
The Hired Gun
How Far Can a Home Lab AI Rig Get Toward Frontier Inference?
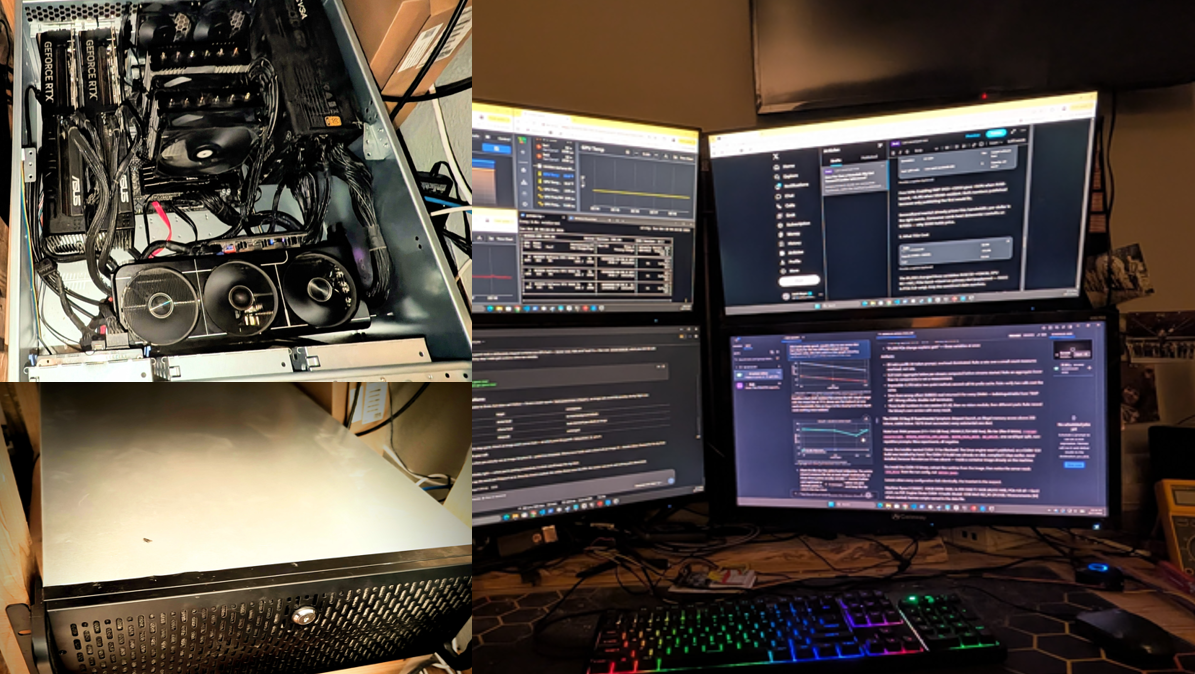
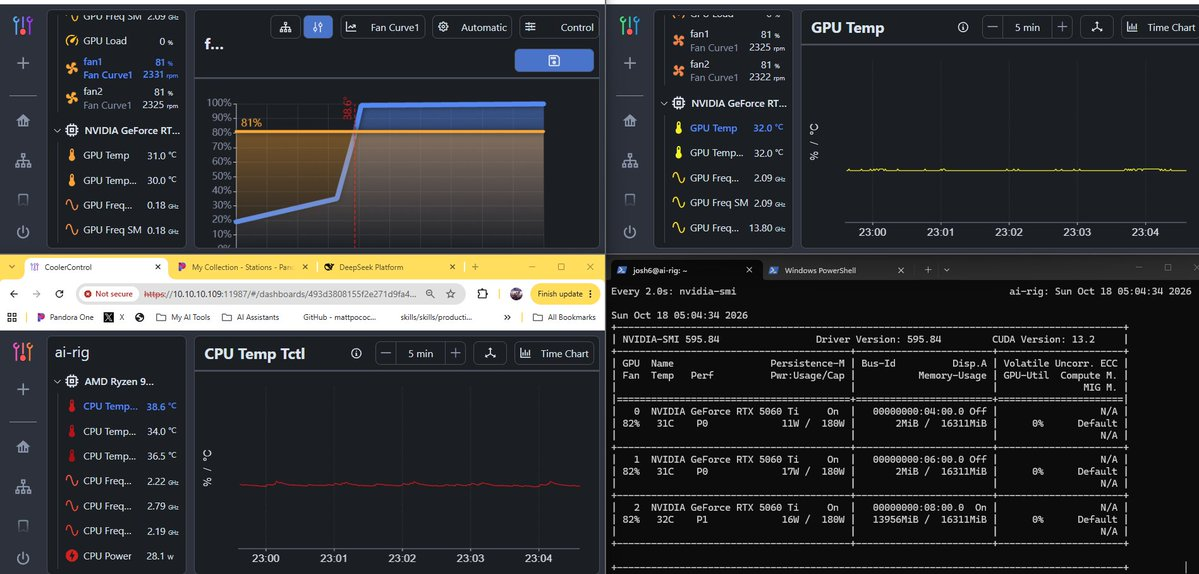 This picture is showing you how the system looks at idle (with the new processor/128GB DRAM) A 125-billion-parameter MoE model runs at 77 tok/s flat across 2K–128K context on a $3,250 consumer rig. That's 25% faster at long context than the vendor's own benchmark, and 10/10 stable where the $2,000 config died after 2–4 requests. The equation that predicts it has a residual of 1.0000×. The answer to the title, stated up front: as far as a resident 125B MoE. Not one step further for dense. The wall is arithmetic, not tuning, and this post shows where the arithmetic stops.
Every number here was produced on hardware I own. First as a $2,000 box (B550 Eagle Wifi6, Ryzen 5 5500, 32GB DDR4, 3x RTX 5060 Ti 16GB), then after a $1,250 upgrade (Ryzen 9 5900XT, 128GB DDR4-3600). Both configurations were measured, and this post says which figure came from which.
Evidence marks: Every claim carries its provenance. Charts plot the same measurements as the tables — nothing is plotted that isn't marked.
[M] measured on this rig
[D] derived arithmetic you can check
[S] external source
[T] theory / interpretation
[F] framework for future work
The Law
One equation explains every decode measurement:
tok/s = (bandwidth ÷ bytes-per-token) × tokens-per-passMeasured residual: 1.0000× across three queue depths [M]. A fit has residuals that move when conditions change. This one doesn't, so it isn't a fit — it's the bound. Every optimization in this post is one of those three terms, and that's why the levers section reads like a checklist instead of a wish list.
The Boundary, As Measured
I was surprised to learn that my PCIe lanes were not as much of a limitation as I expected. An x8 link was worth 8% on prefill and 2% on decode vs x1 [M].
The wall is actually more related to whether the working set fits, and when it doesn't, how the cards are read.
Three cards in a layer split, deliver roughly one card's bandwidth, because layers compute in sequence.
Frontier is impossible on this rig and this post doesn't claim otherwise:
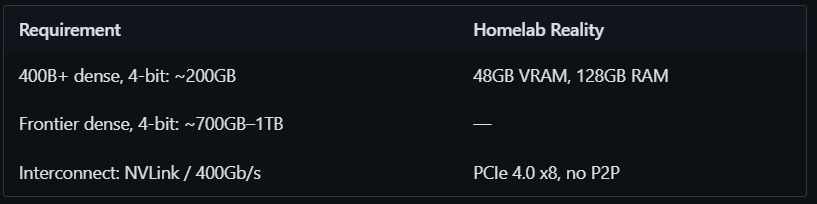 A terabyte doesn't fit in a box with 128GB.
No tuning fixes this.
If bytes-per-token can't be read at the bandwidth available, the tok/s is already decided before the first token.
Four components of the wall:
Capacity: does the working set fit?
Bandwidth: how fast can that memory be read?
Serialisation: with layer split, do cards work in parallel or sequence?
Fixed overhead: per-request cost amortised by long prompts
Flash attention reduces attention traffic, not weight traffic. It helps, but doesn't move the wall for larger models.
The Numbers
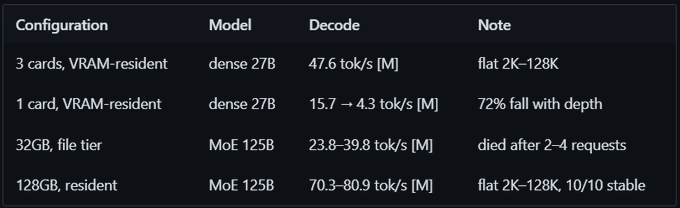 These numbers show how my system responded with VRAM under different loads from my original 32 GB Ram/AMD 5500 setup and then after the 128G upgrade and larger processor.
$3,250 delivers 125B-class inference at 1.6× the decode of a dense 27B on the same hardware [D] — while running a model 4.6× larger [D].
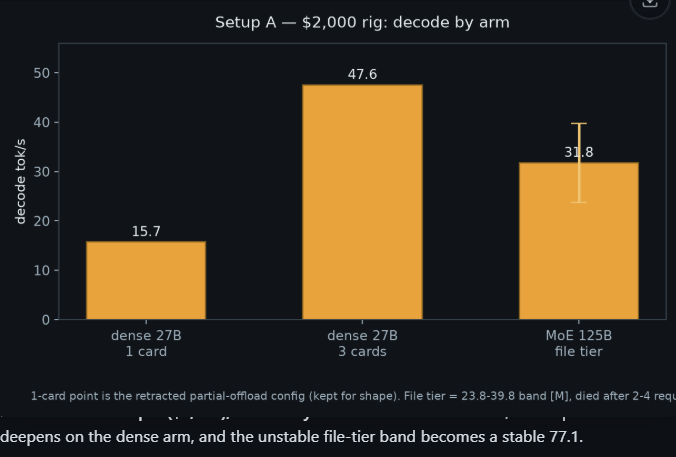 Setup A, decode by arm] Setup A ($2,000), decode by arm [M]. File tier is drawn as its measured band, 23.8–39.8; the plotted point is the midpoint [D]. The 1-card bar is the retracted partial-offload config, kept for shape, not as a baseline.
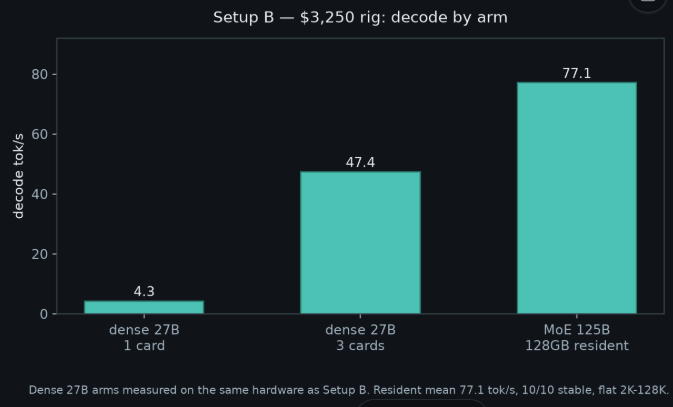 Setup B, decode by arm] Setup B ($3,250), same arms. The pair reads as before/after: the dense 1-card arm falls further, and the unstable file-tier band becomes a stable 77.1. Mean 77.1 is [D] from the four depth measurements, 10/10 runs.
1. The Rig (Changed Mid-Project)
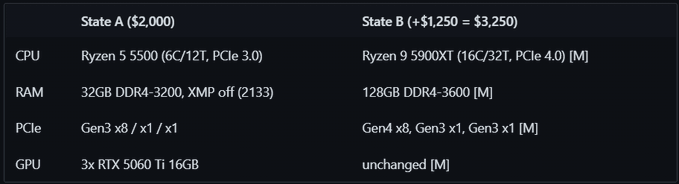 Every row of State B was verified from firmware, not an order confirmation. State B changed three things at once (RAM, CPU, PCIe Gen3→Gen4, so only the combined effect is claimed.
2. Where The Wall Is
A dense model must read every weight every token., A MoE model reads only routed experts at a fraction. That's why 125B runs at all. Its active parameters per token are small; its resident footprint is not.
The law is the same for both models; only the bytes-per-token term differs, and that single term is the entire difference between 47.6 and 77.1.
3. The Measurements
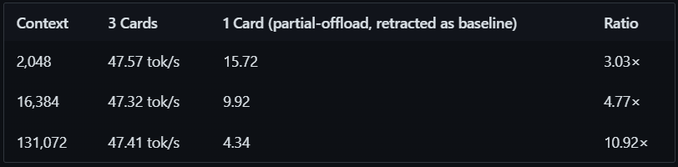
3.1 One Card Trap 15.72 tok/s on one card was a partial-offload config, not a baseline. Card count and offload are confounded in 1-vs-3 comparisons. The table below is kept for the shape of the collapse, with that caveat attached to the single-card column. 3.2 Three Cards, Layer Split — A Ceiling That Is One Card's
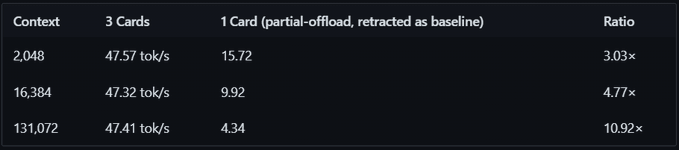 Three cards flat, one card collapses 72%. The engine reports graph splits = N+1 — layers compute in sequence. Three cards = one card's bandwidth, but delays the fall. The ratios grow with depth because the single card falls while the three-card ceiling holds; the ceiling itself is the bandwidth term, and it doesn't move.
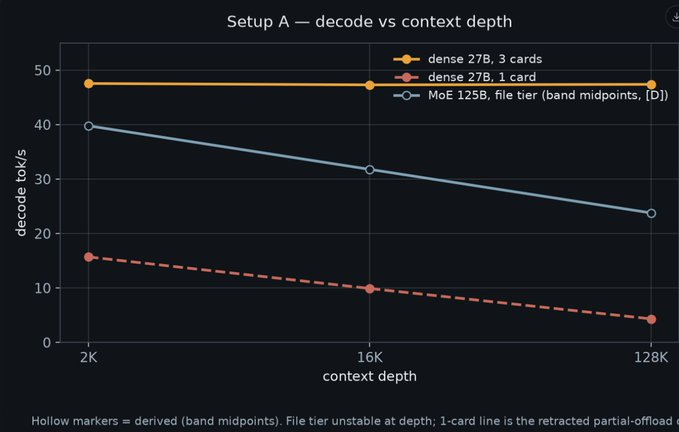 Setup A, decode vs context depth] Setup A, decode vs depth [M]. The divergence is the argument: three cards flat, one card falling, file tier drifting down. Hollow markers are derived — the file-tier line plots band midpoints [D], because file tier was not measured at each depth individually.
3.3 Context Is Latency, Not Memory-Caching a prefix is worth 16× to 105× [M]:
Prefill: 542–730 tok/s. Pay once, then almost free. This caught the project twice — sending the same prompt twice hits prefix cache, and once produced an impossible 1,178 tok/s.
3.4 The Second Tier:
128GB Resident — The HeadlineTwo ways to hold experts:
--mmap-experts — files stay on disk, read per token (file tier)
--resident-experts — copied into RAM, page-locked, no file reads
At 32GB:
1,145 MB from storage per request, 2,492 major faults,
13.3% traffic from storage, died after 2–4 requests.
At 128GB:
resident RAM mode: 28.61 GiB of experts in RAM (page-locked), 6,202 [unit] in GPU cache
expert tiers: GPU hits this request; RAM blobs; files 0 blobs
Files 0 blobs. File tier gone.
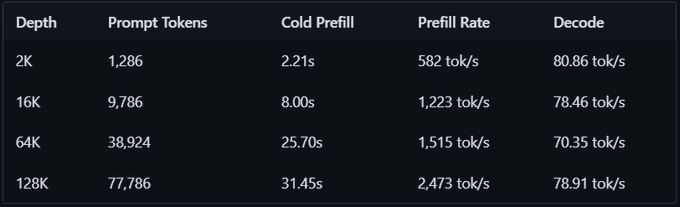 Mean 77.1 tok/s [D], 10/10 stable. Decode flat across a 64× depth range [D].
Two surprises:
prefill rate rises with depth (582→2,473 tok/s) because short prompts are dominated by fixed overhead
16 cores help over long chunks.
3.5 Against Other People's Numbers
Short context: matches vendor (80.9 vs 79). At 128K: 25% ahead (78.9 vs 63) [D] because depth costs almost nothing once resident.
Community 19.6 tok/s lands inside this rig's file-tier band (23.8–39.8) — strongest independent check in the post.
4. What Moves It
Free 50%:
Enabling XMP 2133→3200 gave +50% when RAM-bound, +0.4% when VRAM-resident. Both numbers published because only publishing the first would lie.
Secondhand market already prices this:
bandwidth-per-dollar is the right metric. Consumer cards beat datacenter castoffs on $/GB/s — why 3090 holds price.
5. What This Cost
The $1,250 changed three variables:
RAM 32→128GB,
CPU 6C→16C,
PCIe Gen3→Gen4 on primary slot
Projection that was right:
Before hardware change, 13.3% of traffic from storage bounded the gain arithmetically at:
1.0× (if same speed as RAM),
2.2× at 10× slower,
2.9× at 15× [D].
Predicted 40–90 tok/s. Measured 70.3–80.9. The prediction was made before the hardware arrived, which is the only kind of prediction that counts as a test.
6. Two Directions Forward (No Recommendation)
Direction One: Finish levers evidenced. For: effects measured, costs known, low risk. Against: largest lever is capacity, and capacity is expensive. Improves what already works.
Direction Two: Abandoned software on discarded hardware. Observation: professional accelerators discarded while functional, software unmaintained. $/GB/s says not competitive for decode — but decode is what consumer cards already do well. What about prefill-throughput-per-dollar?
Criterion for worth attempting: a claim that can be made false by one measurement. Both directions pass. Neither attempted.
7. Reproducing This
Harness discipline:
One variable per run
Denominator stated (tok/s of what, over how many tokens)
Cold and warm separated (prefix cache makes the second call free)
Every claim has a mark [M]/[D]/[S]
Failures published
Charts plot only marked values; derived points are drawn hollow and named as derived
Appendix: Retractions & Measurement Artifacts (The Honest Part)
Retracted:
"one card reaches 15.72 tok/s" — was partial-offload, not baseline
"concurrency degrades to 5.24 tok/s" — aggregate below its own per-stream rate
"prefill is 89 tok/s" — measured on 34-token prompt, real ~700
"XMP gives +50%" general — true RAM-bound, +0.4% VRAM-bound
"memory speed costs ~50%" — same confound
"$1,250 PCIe change explains gain" — three variables at once
Artifacts:
89 tok/s prefill: 34-token prompt, overhead dominated. Rule: a rate over a small count measures overhead, not rate.
5.24 tok/s aggregate below per-stream: computed before streams started. Rule: an aggregate lower than its components is not a measurement.
Impossible 1,178 tok/s: two-point method, second call hit prefix cache. Rule: verify two calls cost the same.
Zero from wrong offset: SMBIOS read returned 0 for every DIMM — indistinguishable from "XMP off". Wrong offsets, double-null terminator.
Three build numbers in one session: 0.1.42, then no vision module, then different pack. Rule: record the binary's own version with every result.
The CUDA 13 Bug (9 Experiments)Symptom: dequant launch, an illegal memory access above 200 tokens, stable below. 10/10 short succeeded, every substantial one died.
Ruled out: RAM pressure (111–114 GiB free), VRAM (1,724 MiB free), file tier (files 0 blobs), --vram-reserve-mib, STRATA_PREFILL_CPU_SHARE, ROUTE_TAIL_SKIP, HC_SPLIT, one card/layer split, non-repetitive prompts. Nine experiments, all negative.
Cause: the installer wanted CUDA 13 for Blackwell. The Linux engine wasn't published, so a CUDA 12.8 build was installed by hand. The CUDA 13 build was already on disk, compiled 5 days earlier, never installed, because
.13 was absent — inside a container image already on the machine.
Fix: install the CUDA 13 binary, extract the runtime from the image, then notice the server reads lib_dirs from the run config, not BUILD.json.
Lesson: when every configuration fails identically, the invariant is the suspect.
Machine: Ryzen 9 5900XT, 128GB DDR4-3600, 3x RTX 5060 Ti 16GB (48,933 MiB), PCIe 4.0 x8 + Gen3 x1/x1, no P2P. Engine: Strata CUDA 13 build. Model: 125B MoE IQ2_XS (39.2GB). Measurements: [M] where marked, harness scripts named in the data file.
Comments 0 in this thread